Raconteur Media
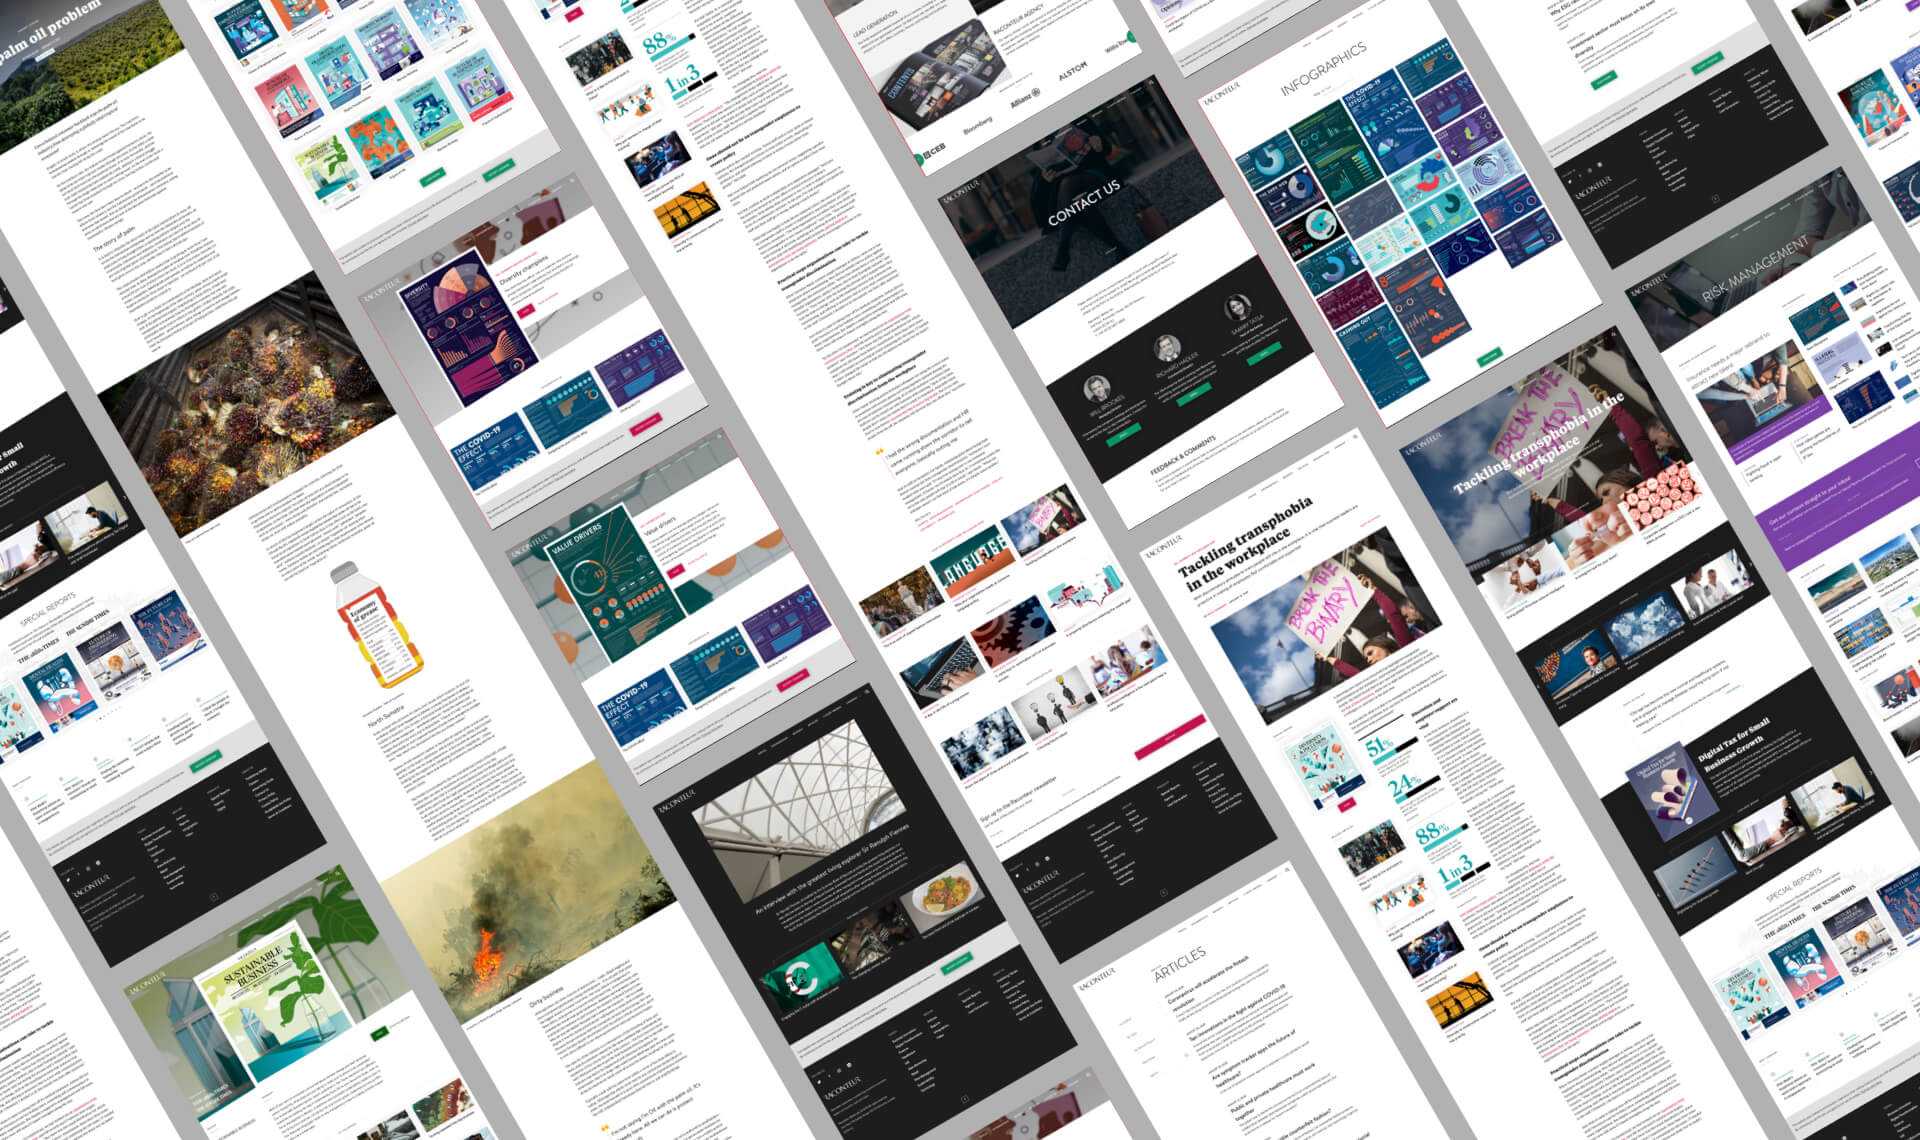
Redesign the main website, establishing in house infrastructures and processes, preparing the ground for a wider digital offering.
Jun 2019
Web Design, Front-end Development, Digital Transformation Consulting
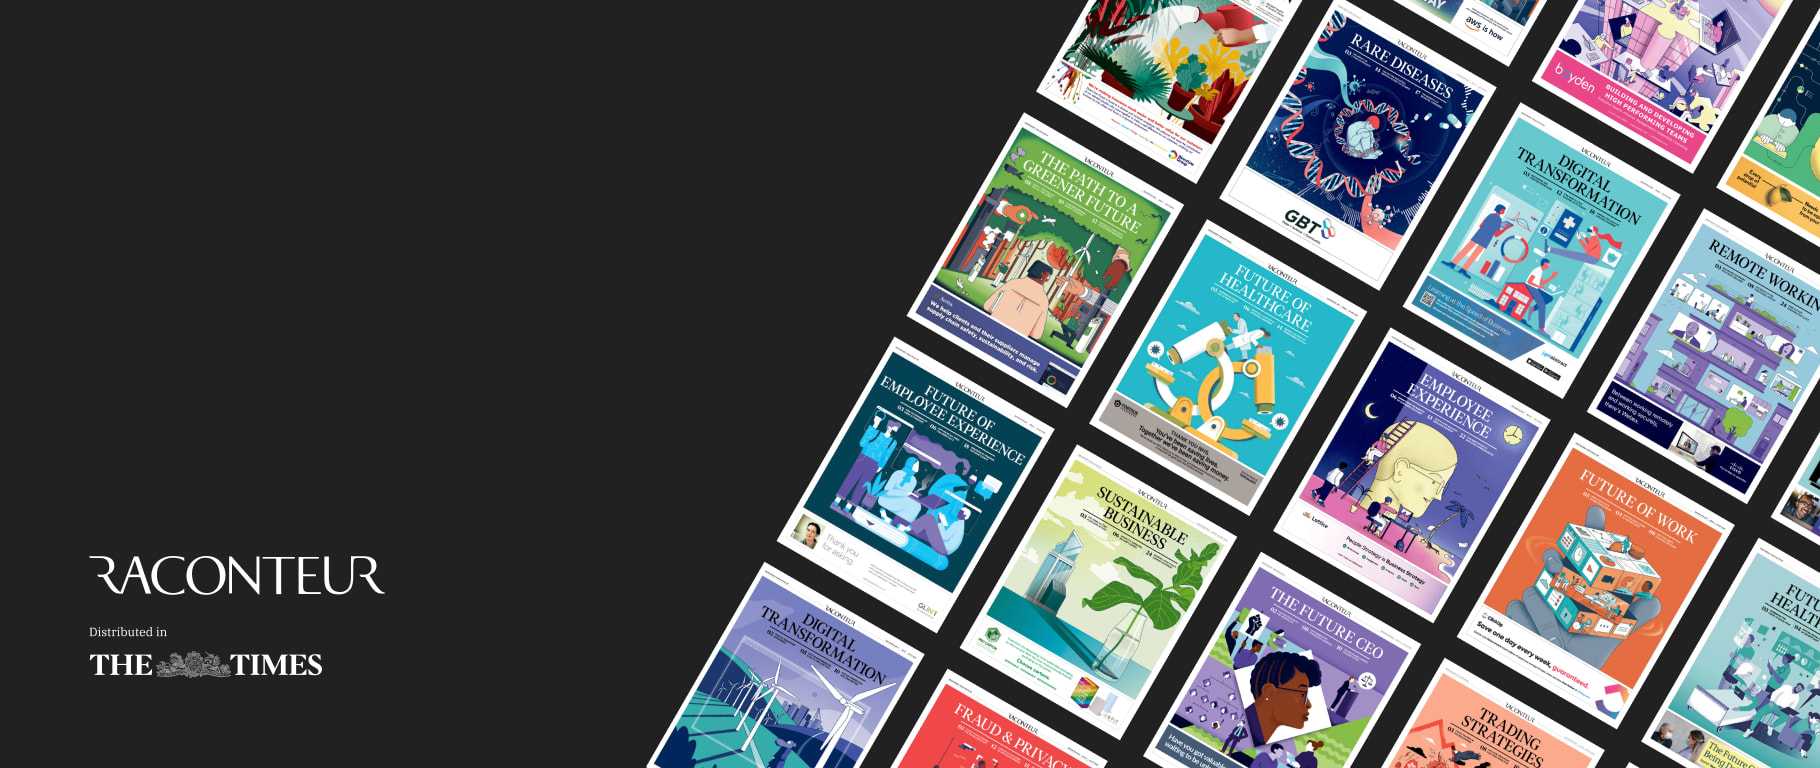
Raconteur Media is an award-winning publishing house and content marketing agency based in London with the freshest ideas and most decisive momentum in the market.
From printed reports in The Times and The Sunday Times to digital publishing and demand generation solutions, Raconteur helps B2B brands stand out as thought leaders, differentiate themselves from the competition and deliver results.

Process and Insights
My work started by identifying three main areas or critical aspects of raconteur.net to be placed at the bottom of the redesign: Content, Design, and Technology:
Content
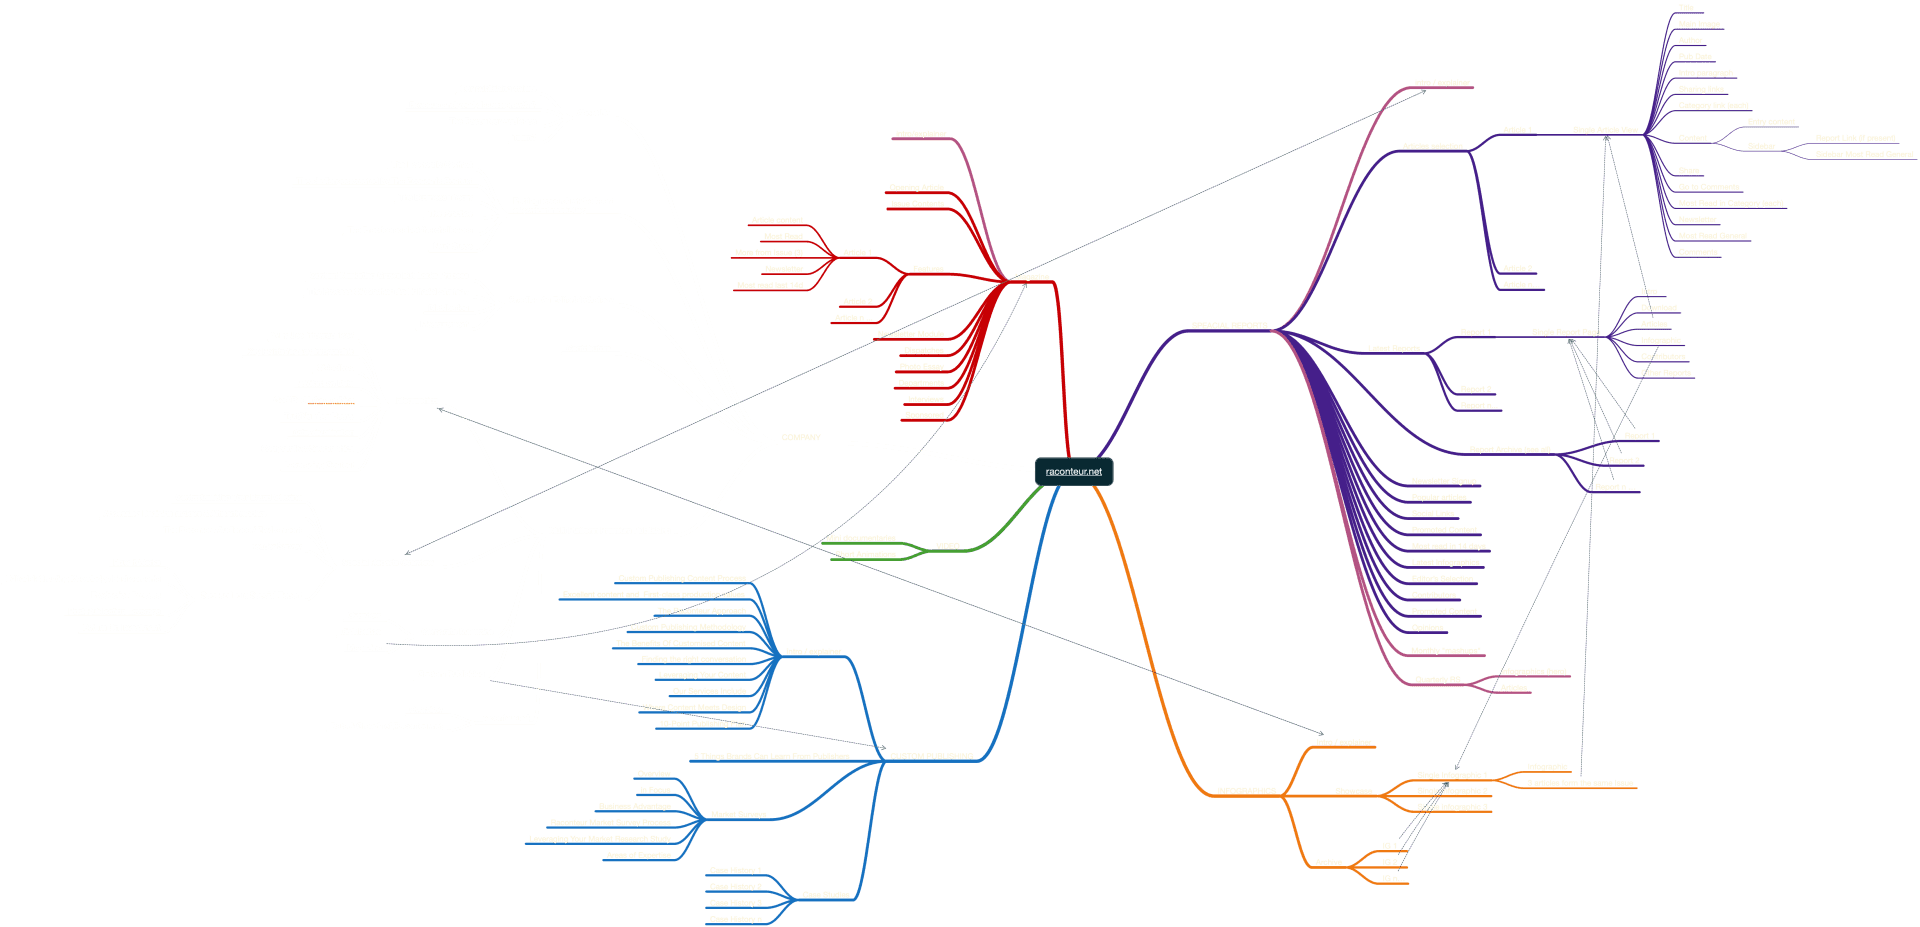
- Analyse the content structure and define a new information architecture.
- Leverage the power of storytelling.
- Define clear goals for each significant target group.
Design
- Channel the value of the design found in the printed products lineup
- Account for subtle variation according to audience/objectives
- Build Design System, to act asd shared vocabulary and living library of Raconteur styles & patterns
Technology
- Rebuild for high performance and mobile-first
- Progressively enhance the experience for desktop and modern browsers
- Move to a cloud infrastructure and define an efficient DevOps workflow
A Reader Oriented IAss
I used Googles Analytics to identifyss the best performing content, common entrance and exit pages and, recurring patterns in the user navigation flow.
Together with the head of marketing, we later compared the evidence gathered with the current data on the website. This process led to deciding to shift the pivot from 'products' to 'content' to develop a structure around our reader's interests.
We then merged our findings with an Extensive Competitive analysis to gather valuable insights on content and features and better understand Raconteur's unique selling proposition.
Chart

Hosting and Dev Ops
We kept using WordPress to reduce the complexity of this redesing iteration but switchig from a conventional hosting provider to the [Pantheon](https://pantheon.io/) infrastructure based on Docker containers to gain:
- Local and Remote Environment Standardisation and Version Control
- Continuous Deployment and Testing
- Isolation and Security
- Virtually unlimited scalability/li>
Wireframings
The wireframes were created in Sketch and then shared in InVision, to gather comments and further iterate each board.
I decided to use a monochrome style (one colour against white) to obtain a straightforward form of wireframing that matches its function. You can read more about it on the UX Movement website at this link: “Why the Best Wireframe Style Is No Style.”
The process continued “wireframing in the browser”, outlining the website's structure, content and features, with actual code and live dynamic data. Then progressively starting to add semantics, ARIA rules and schema metadata relevant to search engines and assistive devices. A crucial step to ensure compliance with content discovery, consumption and syndication's web services.


Final Design
Slicing the spectrum into eight hues to differentiate the primary topics with distinctive colours, loosely following some basic principles of colour psychology common to our European/Western heritage: The last colour iteration aimed to address visual imparities, with rich tonal variations and correction for UI design.

A different Home every day
Slicing the spectrum into eight hues to differentiate the primary topics with distinctive colours, loosely following some basic principles of colour psychology common to our European/Western heritage: The last colour iteration aimed to address visual imparities, with rich tonal variations and correction for UI design.
Outcomes
The main site was published in Jan 2017 and served the business up until September 2020. Live for three years, seven months, and 22 days, gathered tremendous positive feedback and almost doubled its audience, getting closer to 250k/monthly users.
Performance
HotJar 4.1 out of 5
Total Pageviews 12,765,007
New Users - 7,038,019
| Year | Users |
|---|---|
| 2016 | 127,115 |
| 2017 | 155,300 |
| 2018 | 183,908 |
| 2019 | 201,774 |
| 2020 | 243,369* |
projection for the entire year based on data from Jan 2020 to Sept 2020
The Custom Publishing section would have been developed as a stand-alone website to support the division's specific needs and objectivess.
The Custom Publishing section would have been developed as a stand-alone website to support the division's specific needs and objectivess.
The Custom Publishing section would have been developed as a stand-alone website to support the division's specific needs and objectivess.
The Custom Publishing section would have been developed as a stand-alone website to support the division's specific needs and objectivess.
The Custom Publishing section would have been developed as a stand-alone website to support the division's specific needs and objectivess.
The Custom Publishing section would have been developed as a stand-alone website to support the division's specific needs and objectivess.
The Custom Publishing section would have been developed as a stand-alone website to support the division's specific needs and objectivess.
The Custom Publishing section would have been developed as a stand-alone website to support the division's specific needs and objectivess.
The Custom Publishing section would have been developed as a stand-alone website to support the division's specific needs and objectivess.